

Operation Epic Folly?
Charting history to get an inkling of the future.


— President Pump and Dump (?) announcing some market-moving action on February 28. End date… TBC.
An Exercise in Behavioral Finance
In this series, which is heavy on charts, I’ll take a look at the big picture first, then “zoom in” to the detailed picture on what past events could teach about the current times.
This took (and still takes) a lot of effort in terms of collecting data series and harmonizing data across sources.
I hope it can paint the picture and prove useful to some and educational – it certainly was for me when collecting and charting.
Series Primer – from History to Iran 2026
History is a teacher when it comes to not only society, but also the markets, “behavioral finance” guys like myself think that human behavior and markets are inseparable twins, the ying and yang that tug and pull at each other to produce what is known observable reality.
If that is a bit too high-and-mighty for you: humans trade and markets flow; and both can’t be untangled, because efficient markets do not exist. They are traded by humans – and any algorithms are trained and set up by humans with biases and predilections, so they also don’t really count however many tantrums the “EMH” (Efficient Market Hypothesists) throw. Markets do their masters bidding and those masters are: us.
Hence, what you can observe in price, volume and volatility is an expression of the mass of traders, be they human or human-trained algorithms, reacting on what’s observed on the tableau of reality – which is comprised of the news and propaganda, sometimes you can’t even tell which is which, the human condition is to live in the present and take things “as they are” to take decisions for “how we think it’s going to be”. Most of what you read as “financial news” should actually be called “Best Guesses”, using a friendlier term than “Retrofitting the News to a Narrative”, aka “blind guessing”.
Oil goes up? Must be the war. If there’s no war: must be an oil drought and climate change. Climate change doesn’t do it for you? Inflation’s up, so oil naturally follows inflation. Take your pick, it’s all foolishly “retrofitting” to a narrative or generally pattern-matching a given reality (price up or down, massively) to a story as “human digestible” as possible – that’s how you get “War in Iran drives Oil to unprecedented one-day spike” – or something more gripping like “Feel the pain at the pump” level narrative.
But Monty, you’ll scream, markets are efficient, so how can this be?
Efficient Market? Think again.
On the markets, this is observed as the ebb and flow of buying and selling, setting price through what efficient market theorists would call “price discovery through supply and demand”, but what really is that just in part – because demand is driven by wants/needs and supply is regulated by physical restraints. In other words: you can’t get what’s not there. And if you want what everybody else wants, prices will explode upwards until demand is destroyed by price. That’s the only rule that I accept as “efficient” in these markets – things can and will get too expensive for a majority of market participants, which will crater prices in the mean-reverting nature of price discovery.
When a big event enters the picture and disrupts the average push & pull of the markets, you get an outlier. And presently we’re looking at a big one.
The Big One: Epic Fury
With this, the social media equivalent of an opening salvo to prime the news cycle, the US attacked Iran in an eerie replay of a justification that sounds close to George W’s “Weapons of Mass Destruction”, which they never seemed to have found in Iraq. This time, there’s an element of Oil Embargo in the air – and in fact also enacted by the physical closure of the Strait of Hormuz ever since March 2. A week of disrupted supply is ages in the energy markets.
-- George W. Bush on Saddam Hussein’s “Weapons of Mass Destruction”, the justification for invading Iraq.
In this series I’ll deep dive into all of modern “trading history” – ranging from the World War II era which closely followed the 1930s “Great Depression” episode after an eerily similar to today’s manic “golden era” run of the markets, although in a different context. Back then “Radio” was “AI” – but if history is our shepherd, we should be guided by it, not think human programming has suddenly become different.
So: let’s start!

Overview Part I – Great Depression to 1985
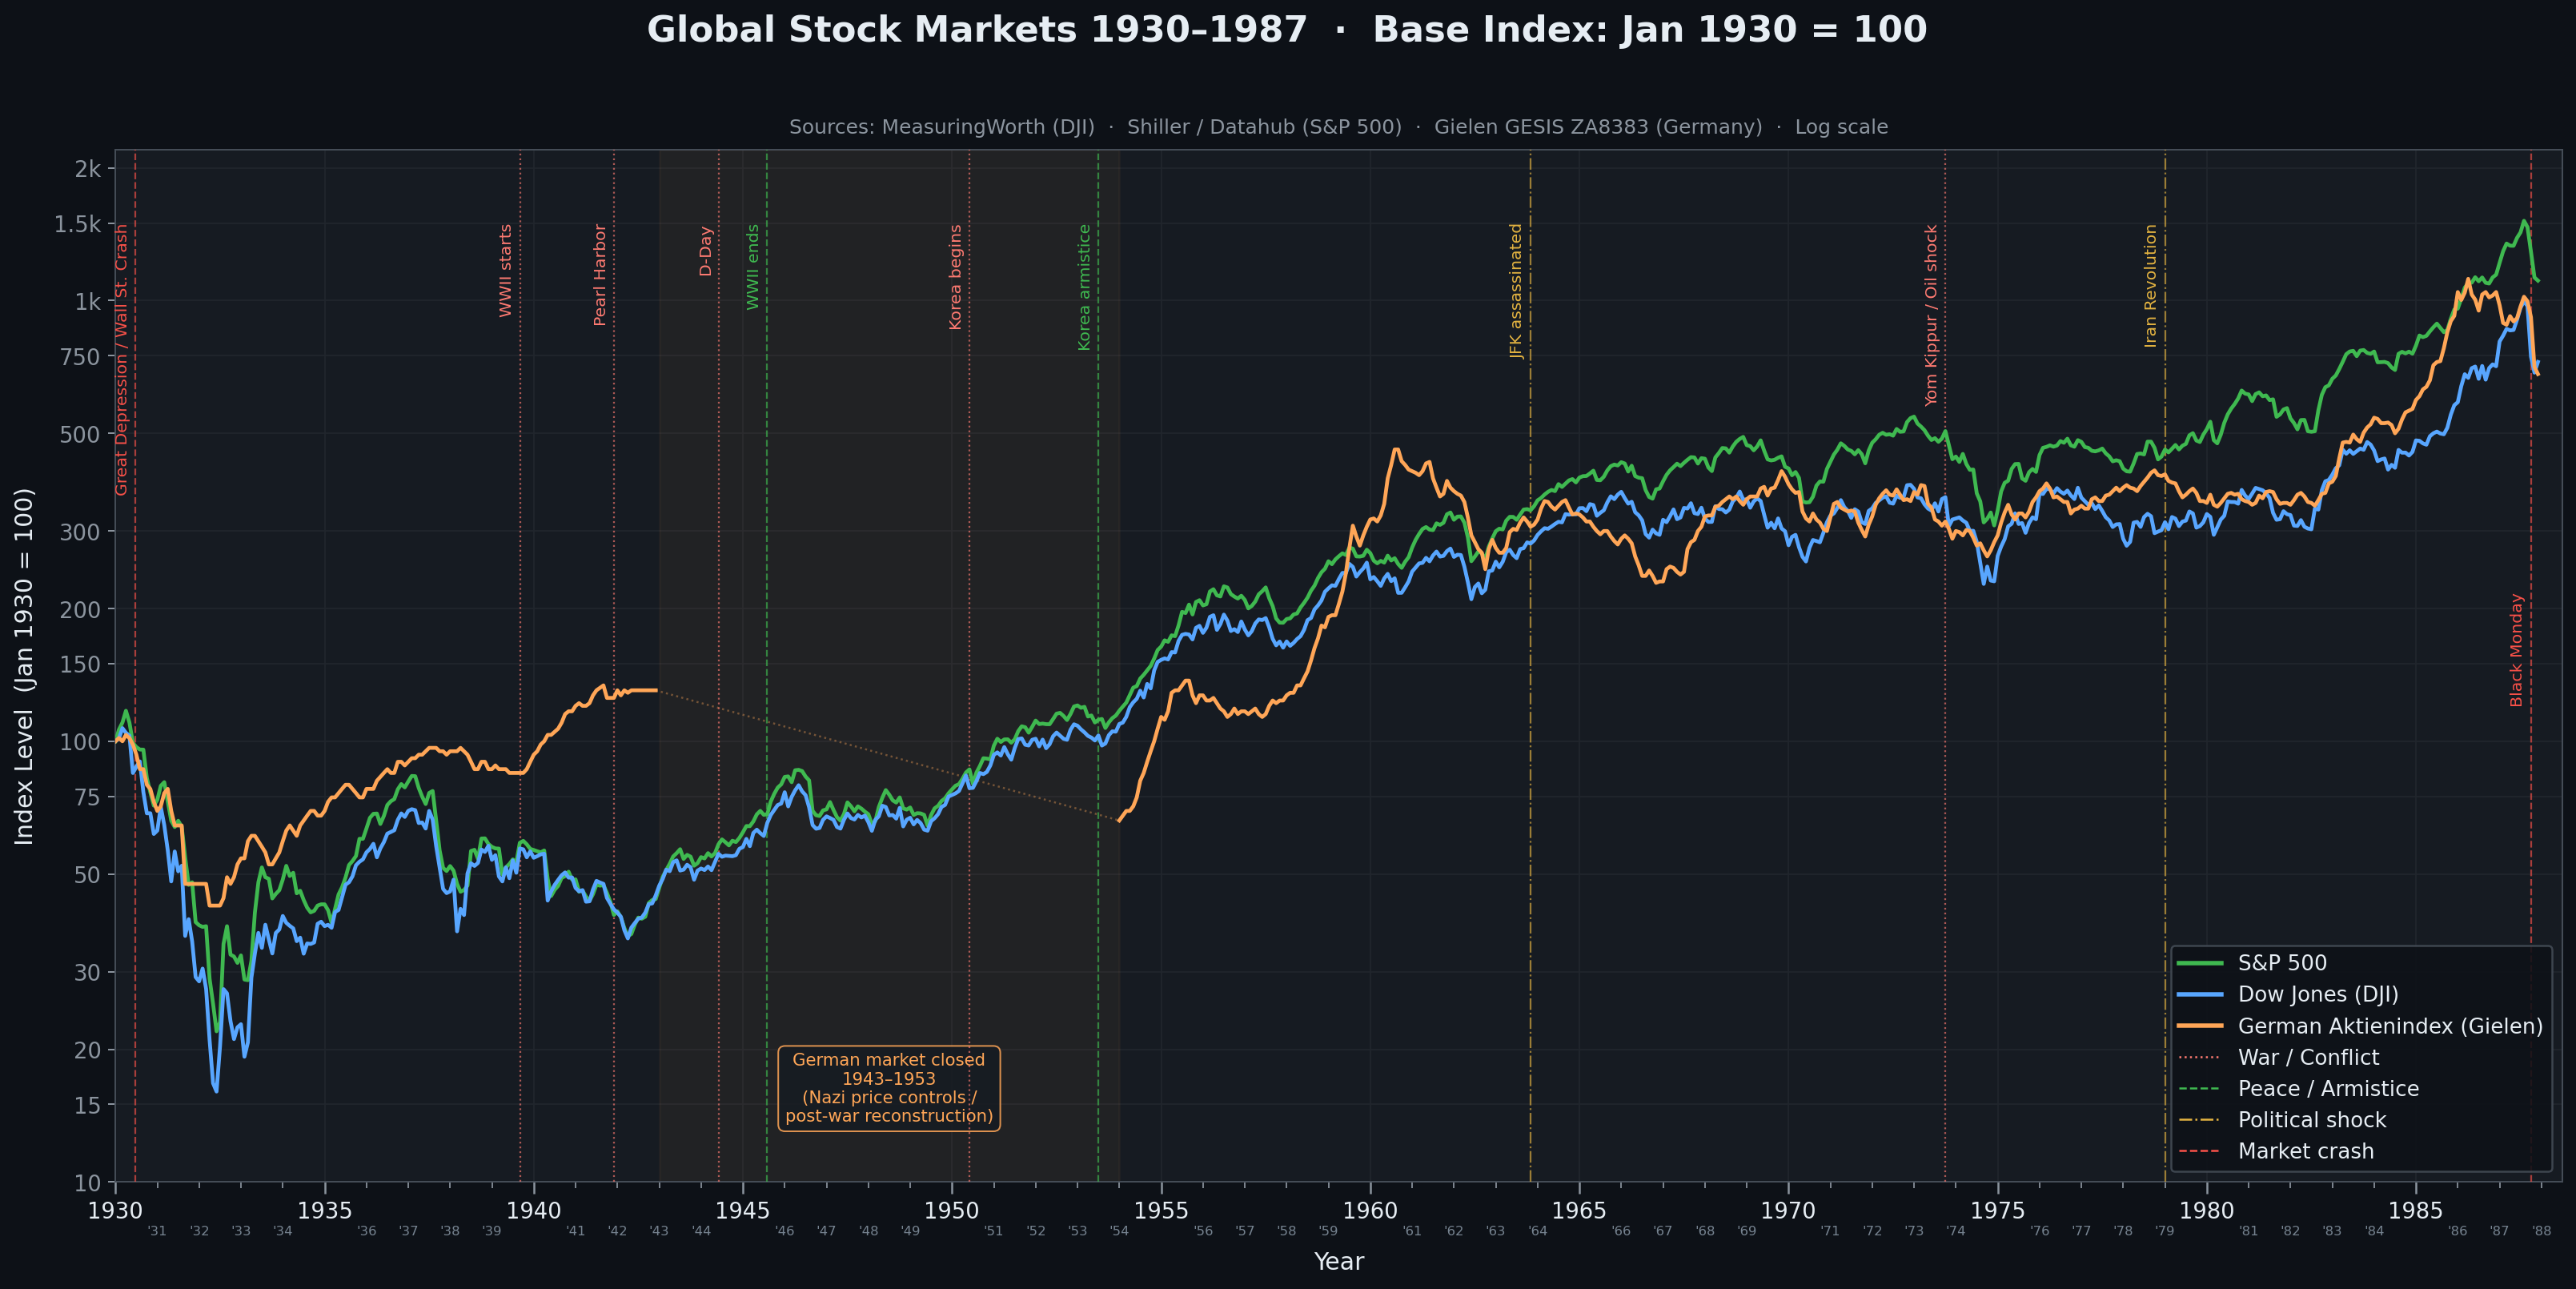
—Overview (Part I): Great Depression to 1985 data series, annotated by me with major event markers.
Note: Data sourced from historic sources as noted; Shiller/Datahub, Measuringworth, GESIS for German data [see citations at bottom1]
Part I — Key Observations
Structure:
Log scale Y-axis from 10 to 2,000 — essential for this 58-year range where S&P 500 grew 15× from its 1932 trough to the 1987 peak
11 annotated events with colour-coded vertical lines: 🔴 conflicts/wars, 🟢 peace/armistice, 🟡 political shocks, and market crashes
German Stock Index (not “DAX” at that time, as a note) has the enforced gap 1943–1953 with a dotted connector and shaded zone.
Notable patterns:
All three markets bottomed together in 1932 (Great Depression trough)
The German index massively diverged and outperformed during 1933–1942 (Nazi-era price controls and war economy)
Post-WWII: American indices recovered sharply from 1945; German index only re-entered after 1954
Yom Kippur/Oil shock 1973 is clearly visible as a sharp reversal on both US indices
Black Monday 1987 shows as an abrupt spike-down at the right edge
While we can see the brutal effects of war on people – markets tell a “factual” story: World War II was a decisive “break” in history, not only a conflict spanning continents but also humans trading based on news (propaganda), fear, possibility and last not least: hope. You can clearly see the hope spikes as the war progressed, the US joined the allies and the German threat was driven back on the eastern front and when D-day hits; markets basically “priced in victory”. But did “the markets” know when Pearl Harbor got attacked by Japanese suicide plane pilots that the war would be won or “good for prices”? One can only guess, looking at the decisive spike right after the event!
To see in more detail, I created “Zoom Charts” for major events and eras.


Now, let’s take a look at World War II:
World War II – Zoom Chart
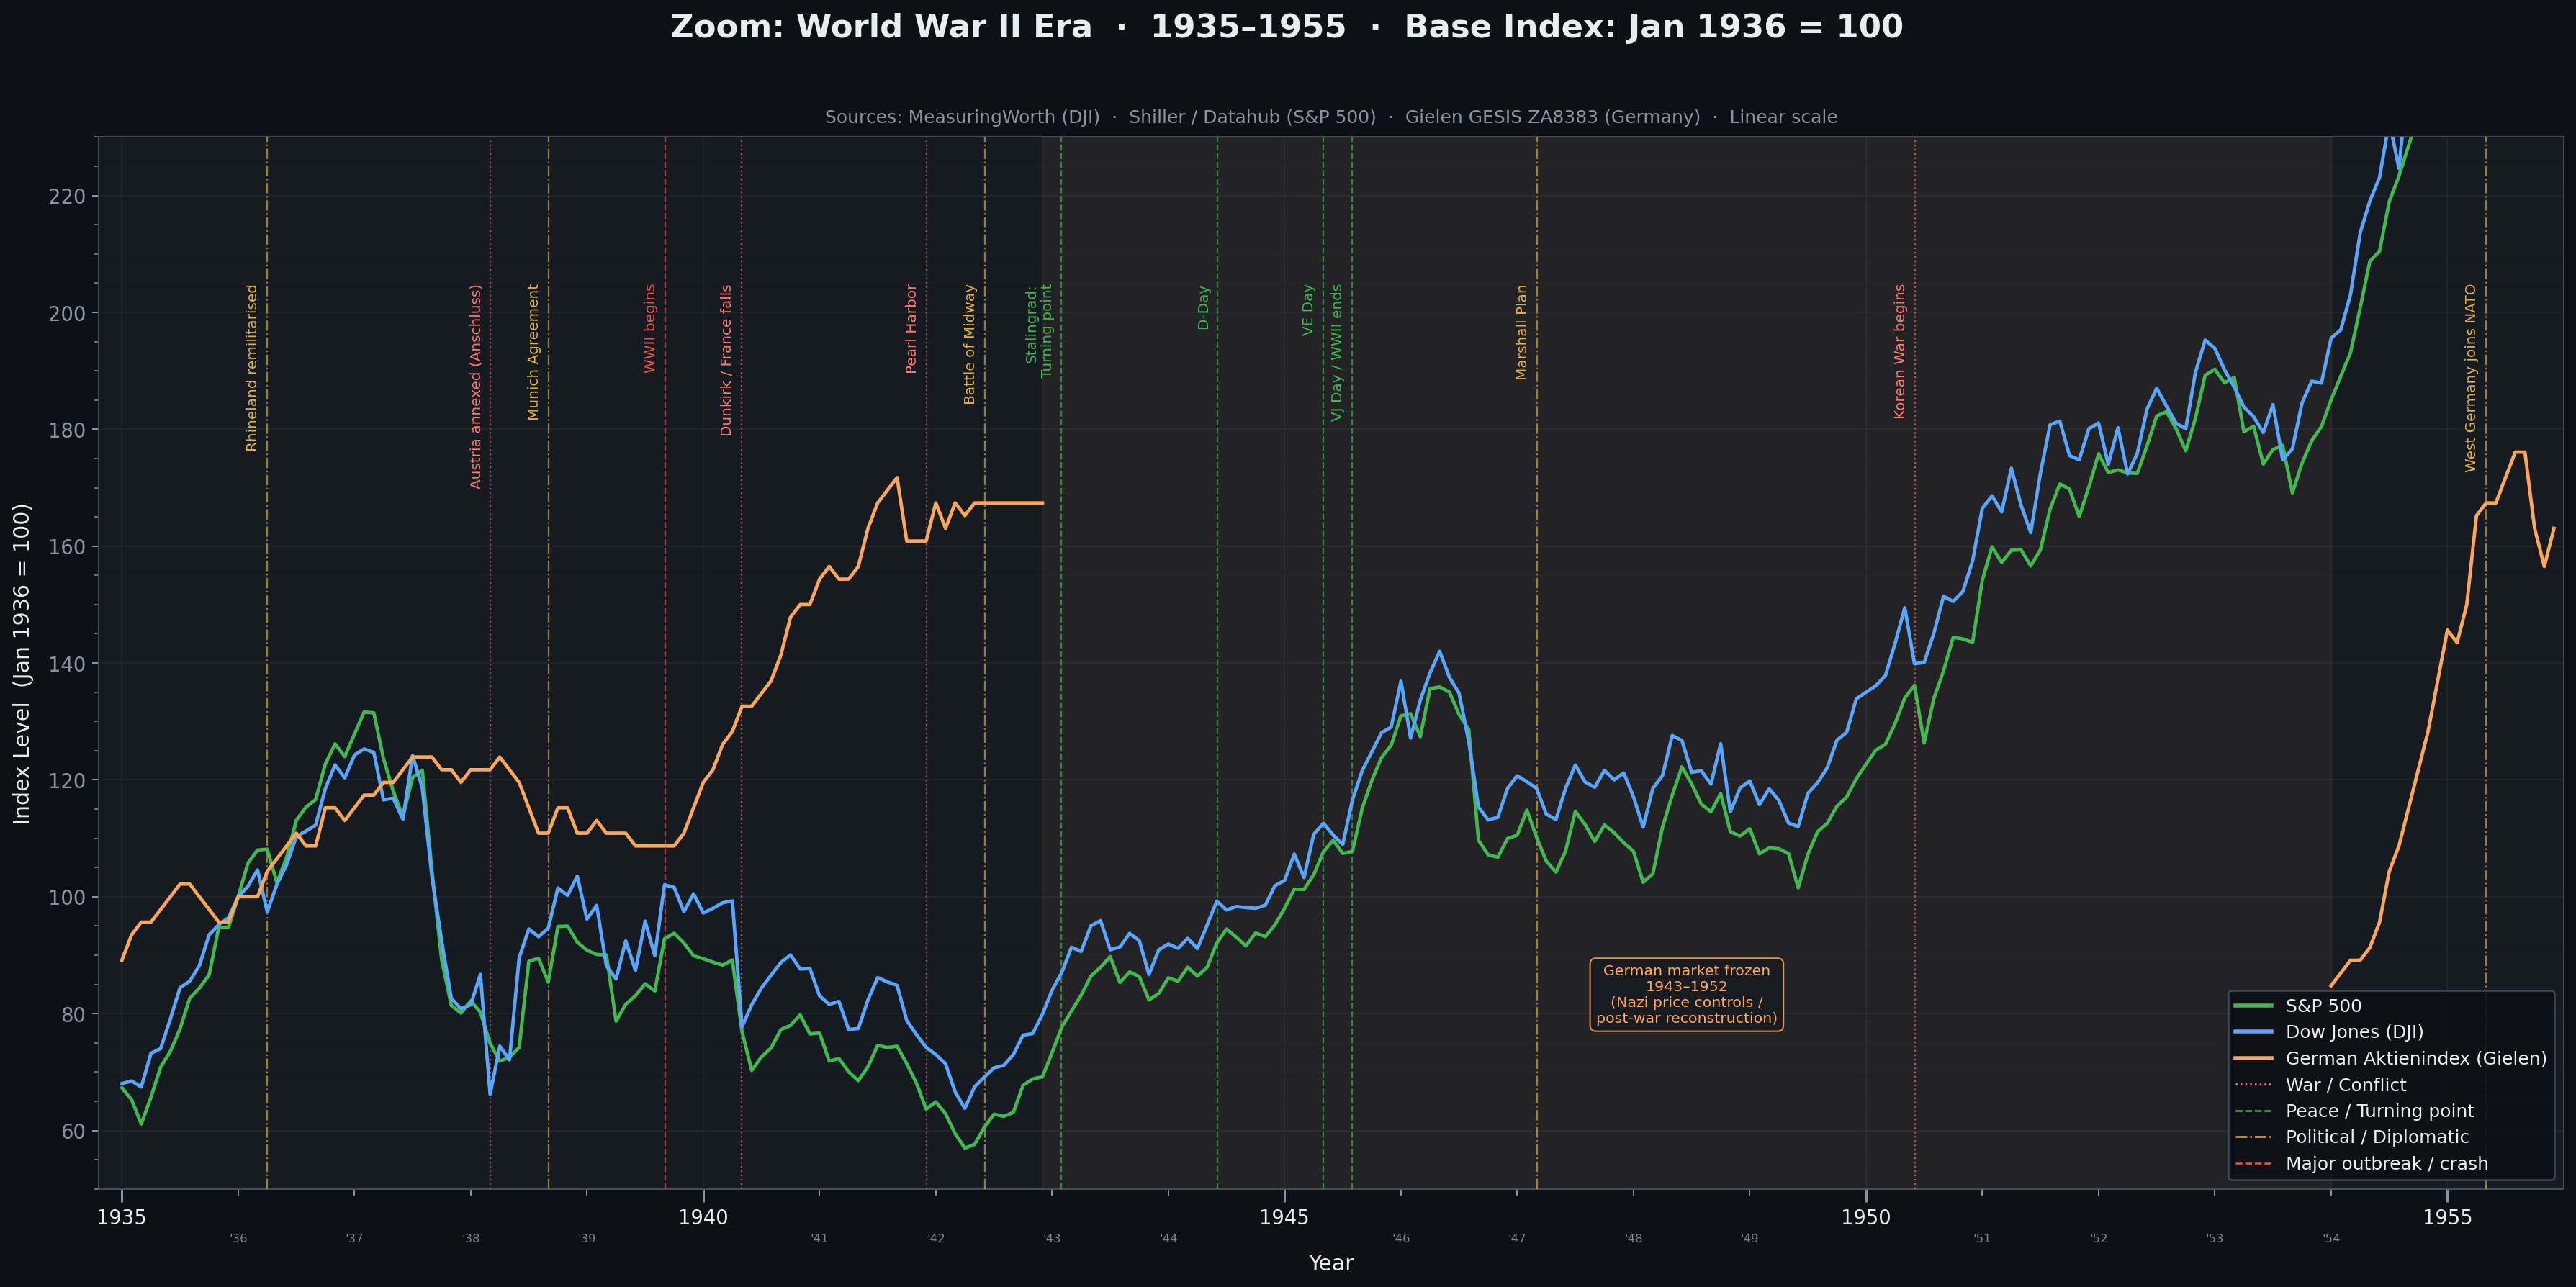
— A detailed look into the WW II era - Note: German markets closed and price-controlled by National Socialists during marked / tinted area and only reopening after more than a decade, devastating any private stockholders. Data citations see bottom.
The “greatest” war – so far – has been World War II. Let’s hope it stays that way, following current developments in Iran.
The key point here is that during WW II, the markets bottomed mid-war (1942), and then rallied +130% before victory was officially visible (or even declared).
Talk about trading on emotions – this one has been researched thoroughly elsewhere, so I’ll be keeping this light. There are detailed annotated charts for “trading on the news” during such a large and chaotic conflict, involving many parties and even continents.
For a large part of the conflict, trading was restricted for war markets. Obviously in Germany, even though the National Socialists loved propaganda, which included a perceived strength of the financial markets, including frozen / forced pricing. Aka “price fixing”.
And while you can “freeze” publicly viewable prices on stocks or bananas and bread, the actual value of the Reichsmark, the currency in the war-torn nation, evaporated more and more the longer the conflict went on. By the end what Germans had was a wheelbarrow full of worthless paper they used for heat - wood was way too expensive.
You can read about the massive devaluation of currencies in my other series – The Rise and Fall of Money, a series about “the big macro picture”.
And before this gets too long: see you in Part II for Korea, Vietnam and Cold War era charts & annotations, out in a few days.

Citations Chart 1 – Great Depression to 1985 & World War II Zoom
Dow Jones Average Data
Samuel H. Williamson, “Daily Closing Values of the DJA in the United States, 1885 to Present,” URL: MeasuringWorth, 2026
Data partly sourced from: S&P Dow Jones Indices LLC via FRED® [DJIA, S&P]
Gielen, G. (2009). Long range trend analysis of the german stock market 1870 to 1993 (ZA8383; Version 1.0.0) [Data set]. GESIS, Cologne. https://doi.org/10.4232/1.8383